Estimated tCPC: the one column that tells you if you overpay for a click

- Estimated tCPC is the cost per click you can afford and still hit your target ROAS. Google does not show it. You build it.
- Put it next to Avg CPC. Higher means room to bid harder. Lower means you pay more than your target allows.
- Track it daily or weekly in a custom report, so you see when something changed.
Google sends you an invoice for every click, whether you paid for that click wisely or not. Most reports tell you what a click cost. Very few tell you what it should have cost. This column does.
What Estimated tCPC is
Estimated tCPC is the calculated cost per click you should be paying to hit your target ROAS. It is not a Google metric. You create it yourself, from numbers that are already in the account.
The formula: (AOV divided by target ROAS), divided by cost per conversion, multiplied by Avg CPC.
It sounds complicated. In practice it is a comparison of two numbers in the same table: what you actually pay (Avg CPC) against what you should pay to meet the target (Estimated tCPC).
AOV divided by cost per conversion is your ROAS. So the formula reduces to Avg CPC × (ROAS ÷ target ROAS). If ROAS is above target, Estimated tCPC lands above Avg CPC. If it is below, it lands below.
How to read it
Estimated tCPC higher than Avg CPC: you have room. You could bid more aggressively and still stay within target. Instead you lose impression share to budget or rank, and leave conversions on the table.
Estimated tCPC lower than Avg CPC: you pay more than your target allows. The bid is too high for that ROAS, or AOV dropped, or cost per conversion went up. Find out which one changed.
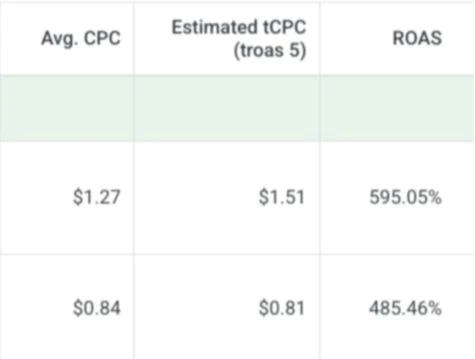
Product 1 pays $1.27 a click and could pay up to $1.51 and still hit a ROAS of 5. That is room to push. Product 2 pays $0.84 when the target allows $0.81. Three cents does not sound like much, but it is exactly why its ROAS sits at 485% instead of 500%.
Two products, one price, one target, kept simple on purpose so the logic is visible without the noise of a mixed catalog. Week by week, a table like this shows where there was room for a more aggressive bid and where the algorithm was holding itself back.
Before you build it: know your target
ROAS or POAS is not the same thing, and the formula changes with what you aim for. If you bid on profit, the target in the formula is your profit target, not a revenue ROAS. If you do not know the number yet, start with your breakeven ROAS.
Make it a report, not a one-off
Build a custom report in Google Ads and watch it daily or weekly. That way you see exactly when something happened, and combined with the other metrics (impression share, conversion rate, AOV) you also find out why.
- Take the products or campaigns with the most spend.
- Next to Avg CPC, add Avg CPC × (ROAS ÷ your target ROAS).
- Mark every row where Estimated tCPC is below Avg CPC. Those are the clicks you overpay for.
Want this column built on your account?
A Written Account Diagnosis reads your account end to end, including where you overpay for clicks and where you leave room unused, and tells you what to fix first.
Senior Google Ads operator with 8+ years of experience, spent the last years almost entirely inside DTC eCommerce accounts. Small number of accounts, no juniors, no handoffs.